JR Logo
CodePens
Updated Nov 2024p5.js

CodePen Visualizations

A collection of interactive and visually captivating sketches created with p5.js and three.js. These sketches explore mathematical patterns, physics simulations, and interactive elements.

A series of CodePen projects showcasing interactive visualizations and animations using p5.js and three.js.

Build Key Features

  1. 01

    Fibonacci Spiral

    A mesmerizing visual representation of a Fibonacci spiral in a galaxy-like formation. Includes adjustable parameters for node size, distance, color, and zoom speed.

    Fibonacci Spiral
  2. 02

    Matrix Rainfall Effect

    An animated Matrix-style rainfall effect with customizable parameters including character density, replacement probability, color, and font.

    Matrix Rainfall Effect
  3. 03

    Plane Curves Visualization

    Interactive visualization of various plane curves including Hypotrochoid, Epitrochoid, Lissajous, Rose Curve, and Spirograph. Customize parameters like radii, frequencies, and number of circles, with real-time updates through a GUI.

    Plane Curves Visualization
  4. 04

    Third Person Controls

    An example of third-person controls in the three.js JavaScript library, featuring a 3D model that can be controlled interactively.

    Third Person Controls
  5. 05

    Interactive Map Visualization

    An interactive map visualization of Omega 365 Advantage holiday house locations worldwide, using jQuery, Bootstrap, and WebGL Earth.

    Interactive Map Visualization
  6. 06

    Coulomb’s Law Simulation

    A Coulomb’s law simulation that visualizes the forces between charged particles. Includes features like teleportation, bounds enforcement, and various physics principles.

    Coulomb’s Law Simulation

Friction Challenges

  1. 1

    Performance Optimization

    Ensuring smooth performance for interactive and computationally intensive sketches, particularly when rendering large numbers of particles or complex animations.

  2. 2

    Cross-Browser Compatibility

    Ensuring that all visualizations work consistently across different browsers and devices.

  3. 3

    Dynamic Parameter Adjustments

    Implementing real-time parameter adjustments via GUI without causing performance degradation or crashes.

Takeaways Learnings

Advanced p5.js Techniques

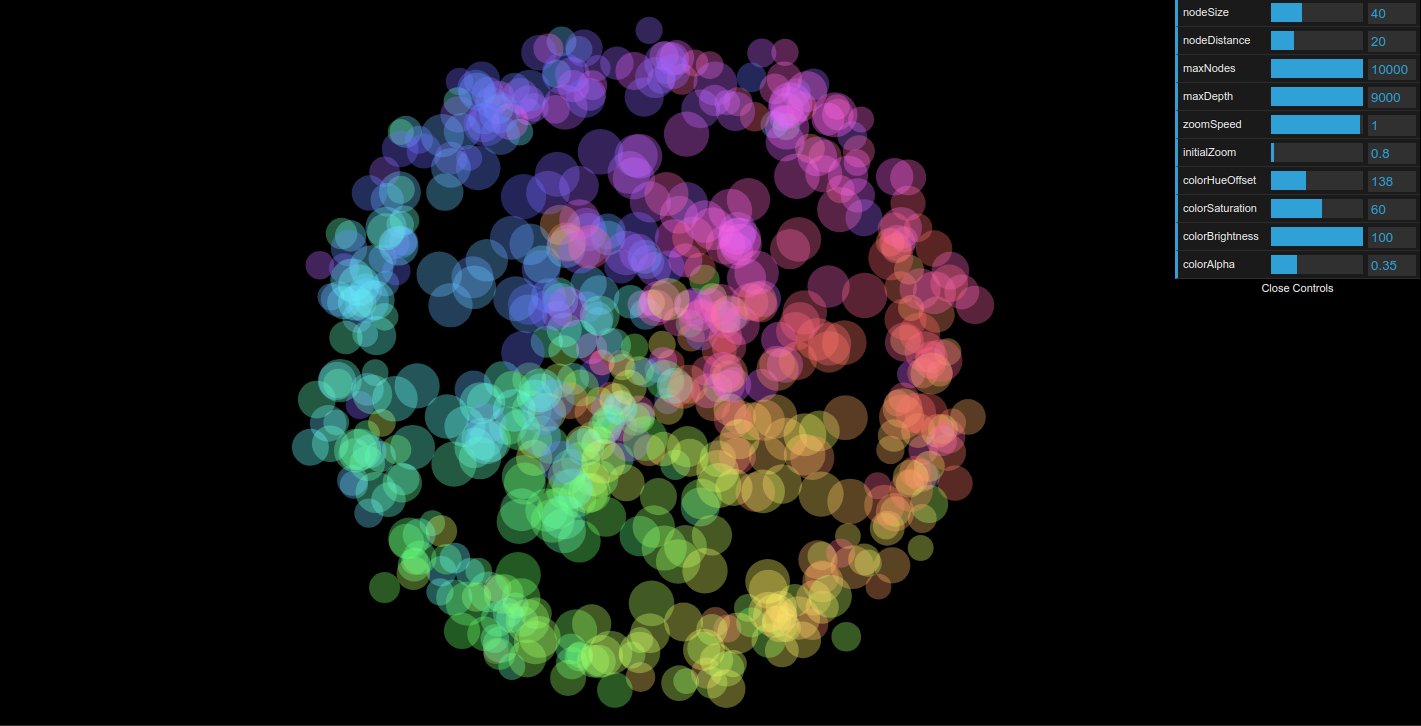
  • Learned to create complex and interactive visualizations using p5.js, leveraging its capabilities for real-time graphics and animations.
  • Gained expertise in handling user inputs and dynamically adjusting visualization parameters.

Three.js and 3D Graphics

  • Developed skills in three.js for creating 3D graphics and animations, including implementing controls and physics simulations.
  • Learned to optimize 3D scenes for performance and responsiveness.

Interactive GUI Implementation

  • Gained experience in integrating interactive GUI elements for real-time parameter adjustments using libraries like dat.GUI.